
Beyond Traditional PE Multiples
A Better Way to Identify Structural Compounder


In contemporary equity markets, strict adherence to classical value investing paradigms has become a structural liability. Over the past several years, relying purely on low Price-to-Earnings (PE) multiples as a margin of safety has proven increasingly counterproductive. Exceptional, high-quality businesses throwing up structural earnings growth are rarely, if ever, priced at forward multiples below 40x. Instead, their valuations remain chronically elevated while their stock prices aggressively hit consecutive multi-year highs.
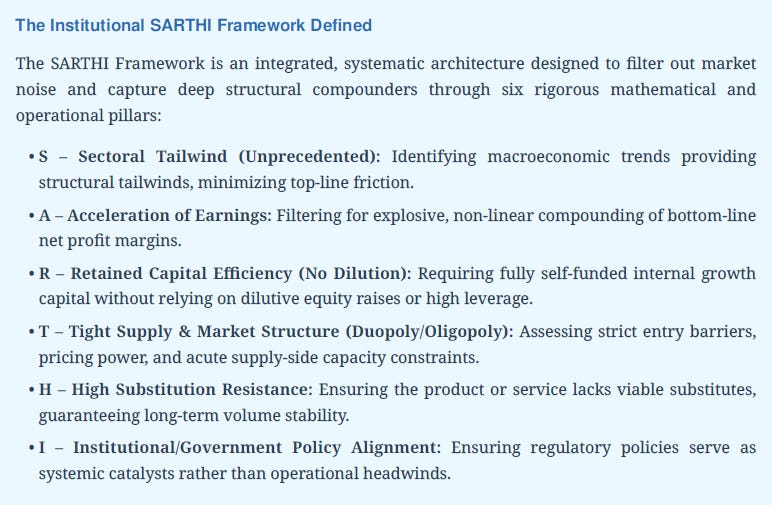
As professional market practitioners, our methodologies must evolve alongside shifting market structures; failing to adapt ensures structural obsolescence. To solve this operational bottleneck, this treatise introduces a formal framework designed to structurally evaluate, underwrite, and exploit asymmetric high-growth opportunities, even at optical valuation premiums. This is engineered by linking operational metrics to our institutional SARTHI Framework.
Structural Pre-Conditions for Premium Multiple Underwriting
To deploy capital safely into companies trading at optics-defying PE multiples, we require absolute convergence among specific fundamental vectors. We do not chase high valuations for their own sake; rather, we target underlying asset physics that make a high PE look fundamentally cheap in hindsight. The explicit prerequisite metrics include:
Structural Sectoral Momentum: An expansive macroeconomic tailwind driving volume acceleration.
Asymmetric Earnings Velocity: Net profits must expand exponentially faster than top-line revenues, indicating severe operating leverage.
Organic Capital Generation: The operational model must require negligible incremental capital expenditure (Capex), utilizing fully internally generated accruals with 0% equity dilution.
Supply-Side Impairment & Zero Intended Competition: Monopolistic, duopolistic, or highly consolidated market structures with severe supply bottlenecks.
Absence of Substitutes: Core products must have high customer stickiness and zero threat of technological or economic displacement.
Regulatory Tailwind Activation: Policy modifications that legally mandate or exponentially expand the addressable volume of the enterprise.
Empirical Case Study 1: Asset-Light Scalability (BSE Ltd.)
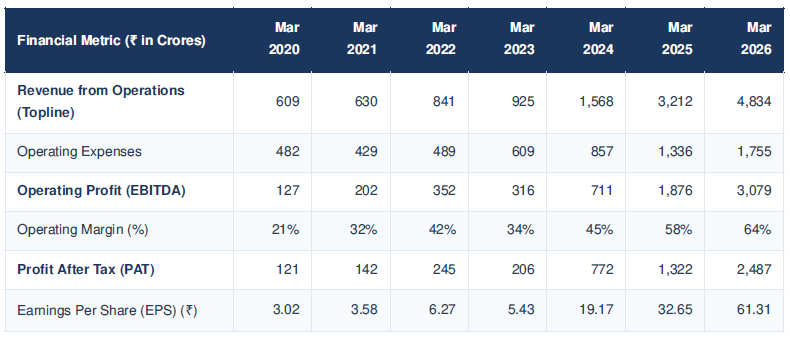
BSE Ltd. provides an empirical proof-of-concept for how an optics-defying PE can be completely dismantled and re-rated via explosive operating leverage. In 2020, BSE traded at a compressed market capitalization of roughly ₹2,500 Crores. Over the subsequent six years, the asset scaled into a staggering ₹175,000 Crores market cap—a massive 70x Market Cap Expansion (and a 50x equity return).
Let us analyze the audited structural financial performance that catalyzed this trajectory:
SARTHI Vector Mapping for BSE Ltd.:
Sectoral Tailwind (S): Structural financialization of Indian household savings, translated into an exponential surge in options trading volumes.
Acceleration of Earnings (A): PAT exploded 20.5x from ₹121 Cr to ₹2,487 Cr. The business model displayed extreme operating leverage as operating margins surged from 21% to 64%. Between Mar 2024 and Mar 2026, BSE captured an incremental revenue of Δ Revenue = ₹3,266 Cr, transforming it into an incremental PAT of Δ PAT = ₹2,316 Cr. This equates to an incremental net conversion rate of 71%; once corporate tax (approx. 25%) was accounted for, virtually every incremental rupee of revenue dropped straight to the bottom line without absorbing fresh capital.
Retained Capital Efficiency (R): Zero external equity capital dilution over the 5-year cycle. Share capital expansion was driven exclusively by non-dilutive stock splits and bonus issues. Gross block grew at a minor 3x rate (from ₹190 Cr to ₹686 Cr), entirely funded via internal accruals.
Tight Supply Structure (T): A strict structural duopoly (NSE and BSE) protected by insurmountable regulatory, clearing-house, and technological barriers.
Institutional Policy Alignment (I): The Securities and Exchange Board of India (SEBI) structured a “one expiry per exchange per week” framework. This specific catalyst repositioned BSE’s derivatives contracts, unlocking unprecedented transactional volume liquidity.
Empirical Case Study 2: Core Manufacturing Scalability (Shilchar Technologies)
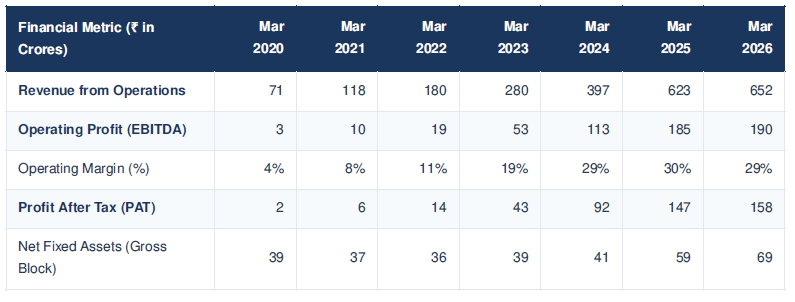
A frequent pushback from conventional market analysts is that asset-light financial infrastructure models cannot be replicated in old-economy manufacturing sectors. Shilchar Technologies entirely refutes this premise, demonstrating a spectacular 225x Capital Appreciation , with its stock rising from ₹27 to a peak of ₹6,110 within 5 years.
SARTHI Vector Mapping for Shilchar Technologies:
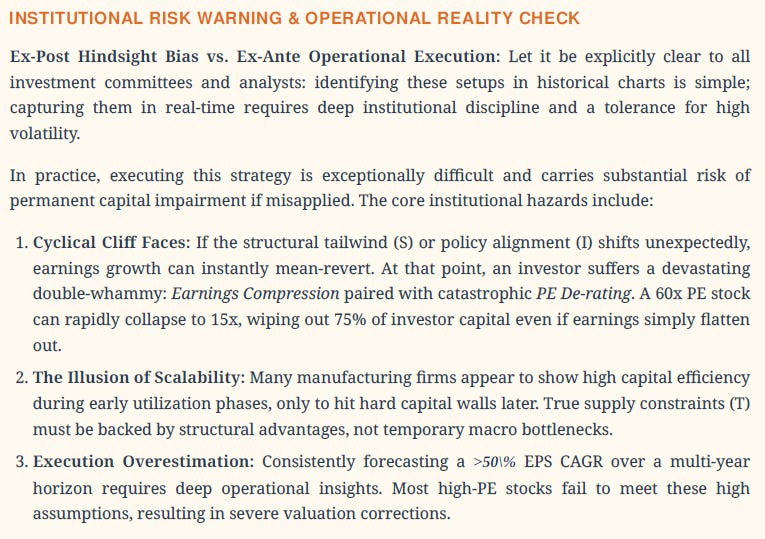
Sectoral Tailwind & Policy (S / I): The global and domestic structural pivot toward utility-scale renewable energy (Solar power generation infrastructure) generated an aggressive demand envelope for highly specialized step-up transformers.
Acceleration of Earnings (A): Audited operational revenue scaled from ₹71 Cr to ₹652 Cr, while operating margins expanded structurally from a commoditized 4% to an institutional-grade 29%. This operating efficiency catalyzed a non-linear 79x explosion in net profit (PAT jumping from ₹2 Cr to ₹158 Cr).
Retained Capital Efficiency (R): Despite being a heavy manufacturing business, Shilchar kept its net fixed asset gross block remarkably flat, moving from ₹39 Cr to just ₹69 Cr. The company expanded capacity dynamically via internal optimization and free cash flow allocations, avoiding dilutive equity raises or toxic debt accumulation.
Tight Supply & High Substitution Resistance (T / H): Stringent technical pre-qualification standards from green energy developers created severe supply-side constraints. Demand drastically outpaced industry manufacturing capacity, granting Shilchar structural pricing power and insulating it from substitution threats.
Deconstructing Valuation Dynamics: The Deceptive PE Multiplier
Standard value investing filters automatically disqualify these enterprises because they operate at significant optical premiums. However, the true pricing engine of these equity compounders relies on a mathematically rigorous Earnings Explosion that naturally unwinds excessive entry PEs.
For instance, Shilchar’s 10-year historical median PE sat at 19x, while its 5-year hyper-growth median expanded to 24x, eventually peaking at an optical ceiling of 60x. In the case of BSE, its historical baseline multiple hovered near 30x, but shifted to a 5-year trailing median of 60x. At its growth peak, BSE’s forward PE multi-year tracking topped 100x+.
Crucially, this optically unsustainable 100x PE compressed rapidly down to 68x purely through organic earnings velocity. This highlights an institutional axiom: When earnings undergo non-linear, geometric expansion, an optically astronomical trailing PE ratio becomes fundamentally irrelevant. To capitalize on this, portfolio managers must shift their focus to the forward Price-to- Earnings-to-Growth (PEG) framework.

Applying this ex-ante backtest to BSE Ltd. using its 2020 metrics reveals the underlying asset mispricing:
Baseline EPS (2020): ₹3.02 | Terminal EPS (2026): ₹61.31
Realized EPS Compound Annual Growth Rate (CAGR): 65.51\% over a 6-year horizon.
Imputed Entry PE (2020 adjusted terms): 10.10x
Resulting Imputed PEG Ratio: 10.10 / 65.51 = 0.15
An ex-ante PEG of 0.15 represents an extreme structural mispricing. Even if an analyst allows for an aggressive, sector-adjusted structural expansion to a Target PEG of 3.00 (reflecting the duopolistic, asset-light nature of a financial exchange), the implied Target PEG multiplier expands the then market cap by 20 times.
When a business combines an Earnings Explosion (A) with structural PE Re-rating (expanding from a trailing base of 10x to a re-rated structural peak of 70x), the mathematical compounding effect shifts from a standard linear multiple to a geometric matrix. This powerful dual engine is what drives 100x+ returns.
Conclusion: The Ongoing Institutional Mandate
Our overarching mandate remains absolute: we are continuously scouring the micro-cap and mid-cap ecosystems to uncover the next structural compounder that meets every facet of the SARTHI framework. These opportunities do not occur frequently—often appearing only once or twice a year globally. However, when the structural parameters align perfectly, our mandate requires us to concentrate capital aggressively, look past optical short-term valuation premiums, and back the underlying compounding mechanics.
Further operational pipeline updates will be disseminated as actionable targets clear our institutional risk and compliance filters.
Disclaimer: The analysis provided in this document is for institutional research and educational purposes only. It does not constitute a formal solicitation, offer, or recommendation to buy, sell, or hold any security, derivative, or financial instrument. The case studies of BSE Ltd. and Shilchar Technologies Ltd. represent historical, ex-post performance and are utilized strictly to demonstrate framework mechanics; they are not indicative of future performance. Equity investments involve substantial systemic and non-systemic risks, including the complete loss of principal capital. Past performance is no guarantee of future results. Valuation multiples are highly volatile and subject to immediate contraction based on macro conditions, regulatory shifts, or execution failures. Portfolio managers and investors must conduct independent due diligence before allocating capital.